Research Article | | Peer-Reviewed

Production and Optimization of Wine from Mixed (Banana and Watermelon) Fruits Using Sacchromys Crevice

Received: 14 May 2024     Accepted: 12 June 2024     Published: 6 September 2024
Views:       Downloads:
Abstract

Winemaking is one of the most ancient technologies and is now one of the most commercially prosperous biotechnological processes. Fruits are one of the most important foods of mankind. They are important for the maintenance of health and improving the quality of our diet. Fruit juices are fermented to produce wine, an alcoholic beverage containing 8 to 11 percent alcohol and 2 to 3 percent sugar with energy values ranging between 70 and 90 kcal per 100ml. Due to the release of amino acids and other nutrients from yeast during fermentation, fruit wines are nutritive and tastier. For this reason, the conversion of fruits to value-added products like wine is very essential. This work aimed to produce and optimize mixed fruit (Banana and Watermelon) wine using saccharomyces cerevisiae. The proximate composition of banana with74 ± 00 of moisture content, 0.33 ± 00 of ash content, 0.23 ± 0.01 crude fat content, 1.65 ± 0.05 crude fiber content, 1.2 ± 0.1 protein content and 22.59% carbohydrate content and 91.5±1.5 moisture content, 0.49 ± 0.017ash content, 0.25 ± 0.01crude fat content, 0.6 ± 0.05 crude fiber content, 0.46 ± 0.02 crude protein content and 6.75% of carbohydrate content watermelon fruit were used for wine production. Primary and secondary fermentation of the fruits lasted for 9 and 21 days respectively, pH, titrable acidity, specific gravity and, total soluble solids (brix) were determined before and after fermentation using standard procedures. The specific gravity of the wine was observed to reduce drastically as the fermentation progressed. The pH of the fruit must decrease from 3 to 2.89 and 4 to 3.2 in different percentage of mixture and titrable acidity also increased 0.67- 0.92 in 75B:25Wm, 0.64 -0.9 in 50B:50Wm, and 0.63-0.89 in 25B:75Wm after fermentation. The highest percentages of alcohol content (9.5) was observed in 75B to 25Wm mixed fruit wine in pH 4 and inoculum size 5, and sensory evaluation revealed that the attributes of the wine were acceptable to the majority of the respondents. This study showed that acceptable wine can be produced from mixed fruits banana and watermelon using yeasts Saccharomyces cerevisiae.

Published in International Journal of Food Science and Biotechnology (Volume 9, Issue 3)
DOI 10.11648/j.ijfsb.20240903.12
Page(s) 46-57
Creative Commons

This is an Open Access article, distributed under the terms of the Creative Commons Attribution 4.0 International License (http://creativecommons.org/licenses/by/4.0/), which permits unrestricted use, distribution and reproduction in any medium or format, provided the original work is properly cited.

Copyright

Copyright © The Author(s), 2024. Published by Science Publishing Group

Keywords

Fermentation, Watermelon, Banana, Sacchromys Crevice, Wine Production

1. Introduction
Winemaking is one of the most ancient technologies and is now one of the most commercially prosperous biotechnological processes. Even though grapes are the main raw material used for wine production, there is an increasing interest in the search for alternative indigenous fruits that are cheap and readily available for winemaking in such countries where grapes are not abundantly available . Fruits are one of the most important foods of mankind. They are important for the maintenance of health and improving the quality of our diet. Fruit juices are fermented to produce wine, an alcoholic beverage that is also nutritive and tastier . Amino acids and other nutrients realized from yeast during fermentation. This increases nutritive value. Fruit wines contain 8 to 11 percent alcohol and 2 to 3 percent sugar with energy values ranging between 70 and 90 kcal per 100ml . Home-made wine production has been practiced with various fruits such as apple, pear, strawberry, cherries, plum, banana, pineapple, oranges, cucumber, watermelon, guava, etc . From those fruits Banana and Watermelon fruits were used in this study. Watermelon which is grown in both tropical and subtropical regions have a lot of nutritional and health benefits. It is known to be rich in electrolytes and water content; low in calories and fats and yet a very rich source of numerous health promoting phyto-nutrients and antioxidants that are essential for optimum health . Banana is a seasonal and highly perishable fruit, which can be available all year round. In addition, any application to produce a marketable, value-added product will improve banana farming economics. Bananas could then compete in the market, either as banana juice or as mixtures with other juices because of their flavor and aroma . Different research has been conducted on fruit wine production in the world. But no more studies on mixed fruit wine production especially in Ethiopia. Therefore; in view of the above benefits of watermelon and Banana; conversion into a value added product like wine will be important. The research aimed to optimize and produce wine from mixed (Banana and Watermelon) fruits using saccharomyces crevice.
2. Material and Method
2.1. Materials and Chemicals
Analytical scale balance (FA2014, China), Digestion unit for Kjeldahl flasks, Distillation unit for Kjeldahl hydro lysates, Oven, Crucibles, Crude fiber Digestion apparatus with the condenser, Muffle furnace (Thermolyne-48,000, Airtight desiccator, Fermenter jar, Hydrometer, ATAGO refractometer pal-1(0-53%) Brix, PH meter (pH-013) material and (98%) Sulfuric acid, (99%) Potassium sulfate, Methyl red indicator, (99.8%) Sodium hydroxide, (99.5%) Boric acid, (99%) Cupric sulfate, Standardized (40%) NaOH solution, Antifoam solution, 0.1% HCL, (99%) n-Hexane, 2% Sodium metabisulfite, and Phenophytaline indicator chemicals were used.
2.2. Sample Collection
Two kilogram of Banana with ripping stage (yellow with some green at the end of the fruit) was purchased from Bahirdar city and put at room temperature for one week increasing its ripening. Four kilograms of ripened (which have a deep hollow sound when we knock with our hand) watermelon fruit used for this study were purchased from Bahirdar city and stored in a refrigerator at 4°C for one week for further processing. Commercial active baker’s yeast (Saccharomyces cerevisiae) used in fermentation and other chemicals of analytical grade were bought from a chemical shop in Bahirdar city. Most of the equipment used was supplied by the University laboratory.
2.3. Proximate Composition
Moister content, ash content, carbohydrate content, and crude fat content of the fruit were determined using methods described by While crude protein content and crude fiber content were determined by using standard (AOAC,-1994) method 991.2 and (AOAC, 2005 method 978.10 respectively.
Determination of moisture content: A crucible was put in the oven at 105°C for 3 hours for drying and then transferred to the desiccator to cool. Then the weight of the empty crucible was recorded. Three grams of fresh sample (pulp) in duplicate was put into the crucible. The sample was evenly distributed on the pre-weighed crucible and spread to uniformity. The crucible with the uniformly spread sample was placed in the oven at 105°C overnight to dry. The crucible containing the sample was transferred into the desiccator to cool and then re-weighed. The weight loss of the sample was the moisture content while the remainder was the dry matter which is used to determine the rest of the nutrient contents.
Calculation of% moisture content =W1-W2W1X100
W1= original weight of sample, W2= weight of sample after drying
Determination of ash content: The crucible was placed in the dry air oven at 105°C overnight to ensure that impurities on the surface of the crucible were burnt off. The crucible was then removed from the dry air oven and cooled in the desiccator for 30 minutes and later weighed. A three gram of evenly distributed sample was weighed and added to the crucible in duplicates and heated over a hot plate until fumes are no longer produced (to burn off the carbon). Using a pair of tongs, the crucibles containing the samples were transferred to the furnace and heated at 550°C for three (3) hours until the sample is burnt to gray, forming ash. The crucibles with the samples (ash) were cooled in the desiccators and weighed. The lost weight from the sample was organic matter while the weight that remained was taken as inorganic matter (ash or mineral content).
Calculation of% ash =W3-W1W2-W1X100
W1= Weight of the empty crucible, W2= weight of the empty crucible plus sample before heating and W3 =Weight of the empty crucible plus the sample residue after heating
Determination of crude fat content: The Soxhlet method was used. The boiling flask was dried in an oven at 105°C overnight. About 5g sample was weighed and put into an extraction thimble which is then transferred into a Soxhlet apparatus. The boiling flask was filled with about 250ml of n-Hexane and placed on the heating mantle. The Soxhlet apparatus was connected as water is turned on to cool them and the heating mantle was switched on to commence crude fat extraction. After 12 hours of extraction, the boiling flask was dried in an oven at 105°C until all the solvent is completely evaporated and the bottle completely dried. After drying, the bottle was transferred to the desiccator to cool. The bottle and its dried contents were re-weighed. The weight gain of the flask was represented by the amount of ether extract (the crude fat).
Calculation of% fat =W2-W1W3X100
W2= weight of flask with sample after draying, W1= weight of flask, W3= weight of sample
Determination of crude protein content: Solutions of methyl red indicator were prepared by dissolving 2 mL of methyl red in 200 mL of ethanol and the Sodium hydroxide solution by dissolving 40 g of NaOH in 100ml of distilled water. Using filter paper, 3 g of potassium sulfate, 0.3 g of cupric sulfate, and 2 g sample were weighed in analytical scale balance and recorded with an accuracy of 0.0001. The reagents and sample were placed in a Kjeldahl flask. 10 mL of concentrated sulfuric acid was added to each Kjeldahl flask and placed in the digestion unit. The heaters of the digestion unit were turned on and acid was digested for 90 minutes until the hydrolysate turns green–turquoise. Turn off the heater of the digestion unit and the hydrolysate was allowed to cool down.
Twenty mL of distilled water was added. In a 100 mL Erlenmeyer flask, 5 mL of boric acid with 20 mL of distilled water was mixed and the tip of the flask was connected to a digestion bulb on the condenser of the nitrogen distillation unit. Then, the Erlenmeyer flask containing the boric acid solution on which was making sure that the tip of the condenser is immersed in the acid solution. Thirty milliliters of the sodium hydroxide solution was added to the distillation unit container. This reaction will release the nitrogen from the hydrolysate. The nitrogen released was trapped by the boric acid solution which was turning green. The green solution was titrated with the normalized HCl solution until the color disappears. Then, more drops were added until the color first turns light-red salmon. Finally, the amount and concentration of the normalized HCl solution consumed to titrate the sample was registered with an accuracy of + 0.1.
%N=(VHcl)(NHcl)(14.007)(mg sample weight)X100
Crude protein= N% x correction factor V=Volume of Hcl used in titration, N =Normality of Hcl, 14.007=Molecular mass of N2
Determination of crude fiber content: Two grams of sample was transferred to a dried and cleaned digestion flask and labeled accordingly. 120 mL of 1.25% H2SO4 and one drop of antifoam solution was added to a separately labeled digestion flask. The flask was placed on the digestion apparatus and the hot plate of the digestion apparatus was turned on to obtain gentle boiling. The sample was digested for 30 minutes. The acid hydrolyses were vacuum-filtered through the Buchner filter device. Without breaking suction, 50 mL of boiling water was added three times. The solids were returned from the filter to the flask for alkaline hydrolysis. 120 mL of 1.25% NaOH solution was added and the flask was placed on the digestion apparatus and the hot plate of the digestion apparatus was turned on to obtain gentle boiling. The sample was digested for an additional 30 minutes.
The alkaline hydrolysate was vacuum-filtered through the Buchner filter device. Without breaking the section, the first 25 mL of boiling 1.25% H2SO4 was added and three additional washes with 50 mL of boiling water were performed. Then the sample was washed with 25 mL of alcohol. The solids from the filter were removed and placed in a tarred crucible for drying and ashing. A tarred crucible with residue was placed in an oven set at 105°C for 8 hours. The crucible was removed from the oven and placed in a desiccator for 30 minutes of cooling. A crucible with fiber residue was weighed in the analytical balance. Then the crucible with the dried residue was placed in a muffle furnace set at 600°C for 4 hours of ashing. The crucible with ash was removed from the muffle furnace and placed in a desiccator for 30 minutes of cooling. Finally, the crucible with ash residue was weighed in the analytical balance.
Calculation of% crude fiber =Loss in weightOrigional sample weaghtX100
Determination of carbohydrate content: The calculation of carbohydrate content was done after completion of the analysis of moisture, ash, crude fiber, ether extract (crude fat), and crude protein. The sum of the percentages of moisture, ash, crude fiber, fat, and protein were subtracted from 100% to obtain carbohydrate content (%) =100% - ash (%) +Moisture content (%)+ crude fiber (%) + crude fat (%) + crude protein (%).
2.4. Preparation of Must
2.4.1. Banana Must Preparation
Two kilograms of ripened banana (yellow with some green at the end of the fruit) was washed with clean boiled water to remove contaminants, peeled using a knife, and sliced into smaller sizes to increase the surface area and ground using sterilized electric blending machine with a speed of 2250 rpm until a homogenous pulp was obtained. Distilled water was added during the blending to avoid friction in the blender then the juice was filtered using a muslin cloth. One liter of distilled water was added and the extracted juice (must) was poured into a clean plastic bucket 100ppm sodium metabisulfite was added to prevent the growth of unwanted microorganisms in the must allowed to stand for capitalization and mixing for further fermentation.
2.4.2. Watermelon Must Preparation
Four kilograms of ripened (which have a deep hollow sound when we knocked with a hand) watermelon fruit was washed with clean boiled water to remove contaminants. The fruit was peeled using a knife and removed seed, sliced into smaller sizes to increase the surface area and ground using a sterilized electric blending machine until a homogenous pulp was obtained. Distilled water was added during the blending to avoid friction in the blender then the juice was filtered using muslin cloth. The extracted juice (must) was poured into a clean plastic bucket and 100ppm sodium metabisulphate was added to prevent growing of unwanted microorganisms in the must allowed to stand for capitalization and mixing for further fermentation.
2.4.3. Mixed Fruit Must Preparation
Musts from both banana and watermelon fruit was symbolized by A, B, and AB for banana, watermelon and mixed fruit must respectively. The mixture was done in 3:1, 1:3; and 1:1 v/v ratio, 500ml of each mixed fruit must which were prepared from a mixing ratio of 3:1, 1:3; and 1:1 v/v was poured in to 2 litter fermenter jars. The brix reading was adjusted by adding 123g of sugar into 1:3, 3:1 and 1:1 ratio prepared mixed must. Lemon juice was used to adjust the pH level and to enhance the flavor of the wine . The must was boiled to sterilize it and allowed to cool before inoculation with yeast .
2.5. Starter Culture Preparation
Yeast cell (biomass) was developed using 50 mL of sterilized YEPD media (1% (m/v) yeast extract, 2% (m/v) peptone, 2% (m/v) glucose) contained in a 150 mL sterilized conical flask. 0.75 g dry baker yeast cell (Saccharomyces cerevisiae) was (hydrated in 50 mL mild hot distilled water at 35°C) added into the YEPD media and diluted to 150 mL using sterilized distilled water. The mixture was incubated in a rotary shaker with a speed of 120 rpm at 28°Cfor 24 hours and transferred into a 1000 mL volumetric flask which contained 200 mL of the sterilized must. The mixture was incubated at 28°C for 24 and at a shaker speed of 150rpm to use directly for wine fermentation .
2.6. Optimization of Fermentation Parameters
Response Surface Methodology (RSM) based on the central composite design was used in the optimization of fermentation conditions for the production of mixed fruit wine. pH, mixing ratio, and inoculum size was chosen as independent variables. Alcohol content (ABV%) was used as the dependent output variable.
2.7. Fermentation
Prior to fermentation the sugar content of must was determined and adjusted by adding 123g of table sugar for each sample. The primary fermentation must last for 9 days in an air-tight plastic container. The starter culture was added in all adjusted pH, inoculum size, and Brix for each run which was done using central composite design expert software and well-mixed prepared must and kept for fermentation in a cool dry place. The mixture was stirred vigorously, every 12 h for consecutive 5 days. PH, specific gravity, titrable acidity, and total soluble solids (Brix) were tasted before raking them into another container. After 9 days, the wine was racked into the secondary fermenter. The secondary fermentation was done in an airtight container from which a tube was passed into a plastic bucket containing clean water.
As fermentation progressed, air bubbles passed into the water through the tube and were used to monitor the course of fermentation. This was allowed for 21 days; when fermentation was assumed to have been completed which was evident from the absence of bubbles in the water container. After fermentation was completed the process was stopped by immersing the jar in a 68-70°C for 10 minutes in a water bath. The wine was filtered as mentioned above and with this; the sensory evaluation was conducted .
2.8. Physiochemical Characterization
PH, specific gravity, titrable acidity, and total soluble solids were analyzed before and after fermentation in each mixed fruit juice and wine. The TSS (Brix) and its specific gravity of must and wine were determined by ATAGO (0‐53º Brix) refractometer and Hydrometer respectively.
2.8.1. PH Determination
The pH of fruit must and wine was determined using AOAC, (2004) procedure. The pH meter electrode was thoroughly rinsed with distilled water and the reading was adjusted to zero mark. The pH meter was then standardized in buffer 4 and 7 solutions at 25°C. Each 10ml of the must be pipette into a beaker and the pH electrode (probe) was dipped into the must and the reading allowed stabilizing before reading off.
2.8.2. Determination of Total Sugar in Fruit Must and Wine
The concentration of soluble sugars was determined with a refractometer. The prism was dried with cotton. Fife drops of the fruit must (juice) and wine was applied to the lens and readings in the degree Brix were obtained .
2.8.3. Determination of Titratable Acidity
This was determined by the methods described by . Two hundred milliliters of distilled water were introduced into a sterile 500ml conical flask and boiled. A Fife drop of 1% aqueous alcoholic phenolphthalein indicator solution was added. This was titrated with 0.1M NaOH solution to give a faint pink color. Fife milliliter of “must” was pipetted and introduced into the boiling neutralized solution and titrated again to the endpoint using the same 0.1M NaOH solution. The titrable acidity was expressed as tartaric acid and was calculated thus:
Tartaric acid g/L= (VxMx75x100)/1000xV
V= volume of NaOH (final reading-initial reading), M= molarity of NaOH, V=Volume of Must, 75 is the equivalent mass of tartaric acid
2.8.4. Alcohol Content Determination
Alcohol content of the fermenting must and the specific gravity of the wine were determined separately. The alcohol content of wine was calculated by the following formula described by .
Alcohol by volume (ABV) = (Original specific gravity-final specific gravity)/7.36 x1000
2.8.5. Sensory Evaluation
Sensory evaluation for taste, color, flavor, aroma and overall acceptability were carried out on a 5-point hedonic scale ranging from “dislike very much” to “like very much”. Out of 5 points hedonic scale, the scores 3.5 and above were selected as acceptable whereas below this level, the products were considered unacceptable by the panelists.
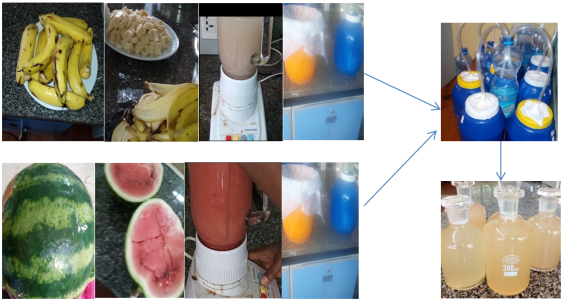
Figure 1. General procedures in mixed fruit wine production.
3. Result and Discussion
This section includes all the laboratory activities which have been done, such as characterization of the raw materials which is Banana and Watermelon fruit-like proximate analysis, which includes: the percentage of moisture content, ash content, crude fat content, crude protein content, crude fiber content as well as carbohydrate content of the sample. All other activities listed above were included in this section.
3.1. Raw Material Characterization
In this experiment, the proximate analysis of moisture content, ash content, crude fat content, crude fiber content, crude protein content, and carbohydrate content of watermelon flesh and banana pulp were determined.
Table 1. Proximate composition of banana and watermelon fruit.

No

Item

Banana (%)

Watermelon (%)

1

MC

74 ± 00

91.5 ± 1.5

2

Ash

0.33 ± 00

0.49 ± 0.017

3

CF

0.23 ± 0.01

0.25 ± 0.01

4

CF

1.65 ± 0.05

0.6 ± 0.05

5

CP

1.2 ± 0.1

0.46 ± 0.02

6

Carbohydrate

22.59

6.7

MC= moisture content, CF= crude fat content, CF=crude fiber content, CP= crude protein content
About 91.5 ± 1.5% moisture content, 0.49 ± 0.017% ash content, 0.25 ± 0.01% crude fat content, 0.6 ± 0.05% crude fiber content, 0.46 ± 0.02% crude protein content and 6.77% carbohydrate were obtained in watermelon flesh and 74% moisture content, 0.33% ash content, 0.23 ± 0.01% crude fat content, 1.65 ± 0.05% crude fiber content, 1.2 ± 0.1% crude protein content and 22.6% of carbohydrate content were obtained in banana pulp. The proximate composition of banana; ash content, crude fiber content and crude fat content were 0.33 ± 0.0%, 1.65 ± 0.05%, 0.23 ± 0.01% respectively. The result was in agreement with the result reported by . Which were 0.33 ± 0.005, 1.43 ± 0.020, and 0.25 ± 0.002 respectively. The crude fat content for watermelon pulp was 0.25 ± 0.01. The result was related to the study conducted by . Ash content and crude protein content of watermelon pulp were 0.49 ± 0.017 and 0.46 ± 0.02 respectively. The result was in agreement with the result reported by . The moisture content of watermelon was similar to the result reported by .
3.2. Physiochemical Characterization of Fruit Must
The sugar concentration of bananas depending on the Brix reading was greater than watermelon fruit and its acidity was also greater when compared with watermelon fruit. The ph. of bananas was measured in ph. mater was 4.6 higher compared with the watermelon fruit ph. of 4.9. Titrable acidity as tartaric acid of watermelon and banana fruit was 0.32 ± 0.02 and 0.39 ± 0.03 respectively indicated in Table 2 So the titrable acidity in banana fruit was greater than the titrable acidity present in watermelon fruit in this experiment. The specific gravity of banana fruit was higher than watermelon fruit; depending on this the sugar concentration was higher in banana fruit. This sugar content with some additional sugar was best for wine production.
Table 2. Fruit must characterization.

No

Parameters

Banana

Watermelon

Banana: Watermelon

75:25

25:75

50:50

1

PH

4.6

4.9

4.63

4.75

4.70

2

TA

0.39 ± 0.03

0.32 ± 0.02

0.37 ± 0.01

0.33 ± 0.02

0.35 ± 0.01

3

SG

1.050

1.020

1.040

1.025

1.030

4

TSS (ºBrix)

12.6

6

10.4

7.1

8.2

TA= Titrable acidity, SG=Specific gravity, TSS= Total soluble solids
3.3. Analysis of Experimental Results
The alcohol content of mixed fruit wine in each run was determined by using a hydrometer by measuring its specific gravity and converting its corresponding value. In this experiment, the highest alcohol content of wine was obtained in Table 3 run number 75B:25Wm mixing ratio, pH. 4 and inoculum size 5% v/v. The lowest alcohol content of mixed fruit wine was observed in run number 20 with a mixing ratio of 25B:75Wm in pH 3 and inoculum size 3%v/v. The banana fruit was higher in sugar concentration and its Brix was upgraded to 21.8 degrees Brix when we add of table sugar compared with other mixing fruit (25B:75Wm and 50B:50Wm) ratio, that was the reason for increasing its alcohol content. The final alcohol content of the wine in this experiment ranks it among good table wines (9.5%). A good table wine must have alcohol content between 8 and 14% found 18.50 ± 0.02% in banana and watermelon fruit wine from 31.2 °Brix.
Table 3. Experimental design generated by design expert software for optimization of fermentation variables.

Factor 1

Factor 2

Factor 3

Response 1

Std

Run

A: mixing Ratio (%)

B:PH

C: Inoculum size (%)

AC (%)

14

1

50

3.5

5

8

6

2

75

3

5

8.8

13

3

50

3.5

3

6.1

2

4

75

3

3

6.1

12

5

50

4

4

8.1

10

6

75

3.5

4

9.1

16

7

50

3.5

4

7.4

9

8

25

3.5

4

5.9

7

9

25

4

5

6.7

8

10

75

4

5

9.5

18

11

50

3.5

4

7.4

4

12

75

4

3

8.2

5

13

25

3

5

7.3

15

14

50

3.5

4

7.5

17

15

50

3.5

4

7.3

3

16

25

4

3

6.1

19

17

50

3.5

4

7.4

11

18

50

3

4

6.7

20

19

50

3.5

4

7.3

1

20

25

3

3

5.5

3.4. ANOVA for Response Surface 2FI Model
Table 4. Analysis of variance (ANOVA) for 2FI model of wine production.

Source

Sum of Squares

Df

Mean Square

F-value

p-value

Model

19.78

6

3.30

21.63

< 0.0001

Significant

A-mixing Ratio

8.65

1

8.65

56.74

< 0.0001

B-PH

3.84

1

3.84

25.22

0.0002

C-Inoculum size

4.36

1

4.36

28.58

0.0001

AB

0.6050

1

0.6050

3.97

0.0678

AC

0.1250

1

0.1250

0.8201

0.3816

BC

2.21

1

2.21

14.47

0.0022

Residual

1.98

13

0.1524

Lack of Fit

1.48

8

0.1852

1.85

0.2577

Not significant

Pure Error

0.5000

5

0.1000

Cor Total

21.77

19

The analysis of variance (ANOVA) was used to determine whether the 2FI model is significantly affected by the Parameters listed in the design or not. The Probability values (P-values) were used to perform as a device to check the significance of each coefficient, which also showed the interaction strength of each parameter. The smaller the p-values are, the bigger the significance of the corresponding coefficient.
The Model F-value of 21.63 implies the model is significant. There is only a 0.01% chance that an F-value this large could occur due to noise. P-values less than 0.0500 indicate model terms are significant. In this case, A, B, C, and BC are significant model terms while AC and AB are not significant model terms. Values greater than 0.1000 indicate the model terms are not significant. If there are many insignificant model terms (not counting those required to support hierarchy), model reduction may improve your model. The Lack of Fit F-value of 1.85 implies the Lack of Fit is not significant relative to the pure error. There is a 25.77% chance that a Lack of Fit F-value this large could occur due to noise. Non-significant lack of fit is good -- we want the model to fit.
3.5. The Interaction Effect of Process Variable on Wine Production
The three-dimensional response surfaces effect was plotted in the figures below as a function of the interactions of any two of the variables by holding the other value of the variable at the center point.
3.5.1. The Interaction Effect of pH and Inoculum Size on Alcohol Content in Wine
The percentage of alcohol content in produced wine was increased in both increasing of inoculum size and ph. decreasing both pH. and inoculum size had a negative influence on the percentage of alcohol content. Changing parameters out of ranges of (pH 3-4 and inoculum size 3-5) will change alcohol content in mixed fruit wine production.
Figure 2. Response surface plot effect of inoculum size and ph. On alcohol content.
3.5.2. The Interaction Effect of pH. and Mixing Ratio in Alcohol Content
The highest alcohol content was observed in pH. 4 for 75B:25Wm mixed fruit wine. Increasing the percentage of banana fruit in this experiment increases the alcohol content because of the higher sugar concentration compared with watermelon fruit. PH. 4 was the optimum pH for a 75B:25Wm ratio which gave 9.5%v/v of alcohol content. Increasing of mixing ratio in fermentation with a low pH value (higher in acidity) will affect the yeast strain in the fermenter and affect our product. In this experiment optimal points in pH and alcohol content were not observed, using the out of (pH 3-4) range will change its optimality.
Figure 3. Response surface plot effect of pH. and mixing ratio on alcohol content.
3.5.3. The Interaction Effect of Inoculum Size and Mixing Ratio on Alcohol Content
High sugar content and high yeast inoculum would translate to high alcohol and vice versa. The highest alcohol content of wine was observed in higher inoculum size and higher percent of banana to watermelon fruit must show in Figure 3. The proper amount of inoculum size for proper sugar concentration was best for wine production. Higher sugar concentration with a small amount of inoculum size will take longer fermentation time and will not give successful full results at a given period of time in wine production. There were significant differences in fermentation performance with different inoculum levels. Faster fermentations were observed with an increased inoculum size and increased alcohol content. The process increasing of inoculum size with a corresponding increase in the percentage of banana to watermelon ratio increases alcohol content of mixed fruit wine didn’t show the optimal point. Using different ranges of process parameters out of this experiment will give its optimal point.
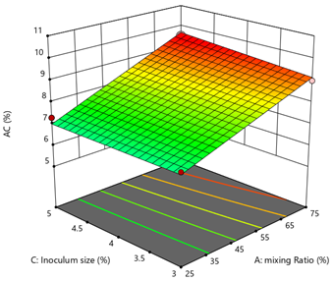
Figure 4. Response surface plot of effect of inoculum size and mixing ratio on alcohol content.
3.6. Physiochemical Characterization of Wine
The specific gravity of the fruit wine produced in this study reduces as the fermentation days increased shown in Table 5. This investigation was similar to the report, the gradual decrease of sugars contained in mixed juices during fermentation activities carried out by Saccharomyces cerevisiae. The continuous decrease of specific gravity is relative to total soluble solid (Brix) decomposition by inoculated activated baker yeast. After 21 days of fermentation, the specific gravity of the wine reduced drastically, this was due to the type of yeast used in the wine production. The Brix of fruit wine was decreased compared with must. The fermentation process greatly reduced the total soluble solids content in degree Brix.
The titrable acidity of produced mixed fruit wine was increased with fermentation time increased. The total acidity of the final wine is expected to be between 0.5 and 1.0% . The titrable acidity for the 75B:25WM combination increased from 0.37±0.01 before fermentation to 0.67-0.91 after fermentation. For 25B:75Wm combination fruit wine, the titrable acidity was increased from 0.33±0.02 before fermentation to 0.63-0.89 after fermentation. The titrable acidity of 50B:50Wm mixed fruit wine was increased from 0.35 before fermentation to 0.64-0.9 after fermentation, in this experiment the result was in agreement with and study’s found 0.85 ± 0.04 titrable acidity of wine from banana fruit. Yeast cells produce many organic acids during fermentation which is the reason for increasing the titrable acidity of wine when we compared it with must (Unfermented juice) in Figure 5.
Table 5. Physiochemical characterization of wine.

No

Parameters

Banana

Watermelon

75B:25WM

25B:75WM

50B:50WM

1

Brix

4.3

2.6

4.9-7.1

2.8-4.9

3.8-6

2

SG

1.015

1.004

1.015-1.025

1.005-1.015

1.010-1.020

3

PH

3.2

3.5

2.89-3.1

2.95-3.2

2.91-3.15

4

TA

0.9±0.04

0.7±0.01

0.67-0.91

0.63-0.89

0.64-0.9

5

AC

10.8

6.9

6.1-9.5

5.5-7.3

6.1-8.1

Figure 5. Titrable acidity of in different mixing ratio produced wine.
In this study, decreasing of pH in wine (Figure 6) was similar to that in banana wine reported that due to the production of acids within the period of fermentation probably arose from the microbial succession. When it is realized that increase in acidity of the samples of wine examined in this study could be due to the accumulation of organic acids during fermentation. The decrease in the pH of the fermenting must makes the must acidic . The low pH of the wine samples protected them against microbial spoilage and also produced at the same time more rapid natural clarification with greater effectiveness of stabilization treatments and longer shelf life. It also increases conducive environment for the growth of desirable organisms. Low pH is known to give fermenting yeasts a competitive advantage in a natural environment . A mixed banana and watermelon wine had a pH of between 2.89 and 3.2. There is a similar investigation on decreasing ph. in wine production from the result reported by . Throughout the period of fermentation, the pH of must is within the acidic range. This was irrespective of the yeast strain used for fermentation. The decrease in the pH of the fermenting must makes the must acidic show acidification of the medium during the fermentation stages, which is very important in wine production. Lack of acidity will result in the production of a poor fermentation process. PH was decreased from 4-3 and 3.5 - 2.89 before fermentation and after fermentation respectively shown in Figure 6.
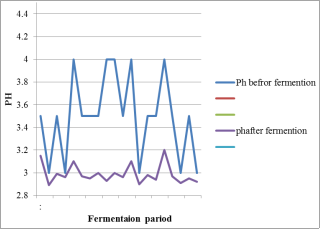
Figure 6. Change in pH after fermentation.
3.7. Sensory Evaluation
The sensory evaluation of all three samples A, B, and C was carried out using 5 points hedonic scale and the data were expressed in terms of mean scores and presented in table 6. Sensory evaluation of the wine samples showed that wines produced from mixtures of fruits were rated best in color, taste aroma and overall acceptability. This could be due to the combined fruit concentration which is incredibly reflected as examined in the characteristic qualities of the fruit wines.
Table 6. Sensory evaluation of mixed fruit wine.

Wine type

Parameters

Over all acceptability

Taste

Color

Aroma

Flavor

A

4

5

4.5

4

4.3

B

5

4

4

4

4.25

C

3.5

4

4

5

4.1

A=75Wm:25B, B=25Wm:75B, C50B:50WM
Among the three samples A, recorded the highest score for overall acceptability 4.3 followed by B (4.25), whereas the significantly lowest score was observed in C (4.1). The results indicated that among the three samples (A, B, C), A had the highest sensory attributes from others. It had the highest overall acceptability. Hence sample A was considered the acceptable composition for the production of wine. The wine produced from 25B:75Wm gets the highest acceptability in response to sensory evaluation. But its alcohol content was lower compared with 75B:25Wm mixed wine. Due to its many health benefits and its acceptability by panelists mixing watermelon fruit is essential.
4. Conclusion
There are a number of underutilized fruits and vegetables in the tropics that can be exploited for wine production purposes. The highest alcohol content of wine was obtained from the 75B:25Wm mixing ratio. It is important to mix banana fruit with watermelon fruit which has the highest nutritional and health benefits. This study has demonstrated that wine of good quality could be produced from mixed watermelon and banana fruit. The wine produced from mixed banana and watermelon fruit has been found to be acceptable, as well as meeting all the standards required by a good wine in terms of physiochemical and sensory attributes of color, flavor, taste, aroma, and overall acceptability for mixed fruit wines. Response Surface Methodology (RSM) based on central composite design (CCD) experiments was used to optimize process parameters for wine production from mixed banana and watermelon fruit.
Abbreviations

PH

Power of Hydrogen

RSM

Response Surface Methodology

B

Banana

Wm

Watermelon

CCD

Central Composite Design

TA

Titrable Acidity

AC

Alcohol Content

Acknowledgments
The author gratefully acknowledges the financial support provided by Ethiopian Institutes of Agricultural Research.
Author Contributions
Asmarech Yeshaneh is the sole author. The author read and approved the final manuscript.
Conflicts of Interest
The authors declare no conflicts of interest.
References
[1] Ajit, E. J., Dominic, D., Farook, F., Promod, A., Kumar, B. M. S., Vj, B., Chandran, R. (2018). Preparation of wine from fruits of Musa acuminate and Ananas comosus; its Physico-chemical analysis and sensory evaluation. 5(6), 1–5.
[2] Anaukwu, C. G. (2015). Wine Production from Mixed Fruits (Pineapple and Watermelon) Using High Alcohol Tolerant Yeast Isolated from Palm Wine.
[3] Balamaze, J., and Wambete, J. (2017). Production of good quality wine from single and mixture of fruit peels. African Journal of Food, Agriculture, Nutrition and Development, 17(1), 11822–11831.
[4] Cheirsilp, B., and Umsakul, K. (2008). Processing of banana-based wine products using pectinase and α-amylase. Journal of Food Process Engineering, 31(1), 78–90.
[5] Ogodo, A. C., Ugbogu, O. C., Ugbogu, A. E., and Ezeonu, C. S. (2015). Production of mixed fruit (pawpaw, banana, and watermelon) wine using Saccharomyces cerevisiae isolated from palm wine. SpringerPlus, 4(1), 1–11.
[6] Sevda SB, Khartmol P and Rodrigues L (2010). Studies in preparation of banana wine (fruit wine) poster
[7] Okafor, D. C., Ihediohanma, N. C.; Abolude D. S.; Onuegbu N. C.; Osuji, C. M. and Ofoedu C. E. (2014). Physico-chemical and Sensory Acceptability of Soursop (Annonamuricata) Wine. International Journal of Life Sciences. 3(4). 163-169.
[8] Izundu., A, O. O, Pauline., A. I, and Ukamaka, O. G. (2016). Proximate Compositions of fruits of Three Musa Species at Three Stages of Development. 15(6), 107–117.
[9] Awe, S., & Nnadoze, S. (2015). Production and Microbiological Assesment of Date Palm (Phoenix dactylifera L.) Fruit Wine. British Microbiology Research Journal, 8(3), 480–488.
[10] Inuwa, H. M., Aina, V. O., Gabi, B., Aimola, I., & Thompson, V. (2011). Determination of Differences in Nutrient Composition of Citrullus vulgaries (Water Melon) Fruits after Plucking. 2(September 2010), 27–30.
[11] John, P. G., Yusufu, M. I., & Ahemen, S. A. (2018). Production and Quality Evaluation of Wine from Watermelon Juice and Ginger Extract. J Hum Nutr Food Sci, 6(1), 1122.
[12] Kyayesimira, J., Mawanda, I., Andama, M., & Safari, D. (2019). Studies on the utilization and proximate composition of wild Aframomum anguistifolium (son
[13] Mohammed, S. S. D., & Yabaya, A. (2021). Fruit wine produced from pawpaw (carica papaya) and watermelon (citrullus vulgaris) using saccharomyces cerevisiae isolated from selected. 16(4), 419–427.
[14] Soibam, H., Ayam, V. S., & Chakraborty, I. (2016). Evaluation of Wine prepared from Sugarcane and Watermelon Juice. 6(2), 475–479.
[15] Edulis, P., Indica, M. M., Comosus, A., & Nzabuheraheza, F. D. (n.d.). Golden wine produced from mixed juices of passion fruit. 9104–9116.
[16] Kiribhaga, S., Gomez, S., Joseph, M., & Gopal, S. (2020). Biochemical changes of banana wine during storage. (January).
[17] Olayinka, B. U., & Etejere, E. O. (2018). Proximate and chemical compositions of watermelon (Citrullus lanatus (Thunb.) Matsum and Nakai cv red and cucumber (Cucumis sativus L. cv Pipino). International Food Research Journal, 25(3), 1060–1066.
[18] Akharaiyi F. C, & Omoya F. O. (2005). Physicochemical determination and sensory evaluation ofwine produced from selected tropical fruits. Biosci., Biotech. Res. 3, 21–28.
[19] Tsegay, Z. T., & Gebremedhin, K. M. (2019). Physicochemical and sensory properties of wine produced from blended cactus pear (opuntia ficus-indica) and lantana camara (L. camara) Fruits. Journal of Food Quality, 2019.
[20] Adebowale, A. P., Adegoke, G. O., & Adeboyejo, O. (2020). Chemical, Microbiological and Sensory Profiles of Mixed Fruit Wine from Banana (Musa acuminata), Watermelon (Citrullus vulgaris L.), Pineapple (Ananas comoscus L.) and Cucumber (Cucumissativus). 4(3), 24–30.
[21] Ningli, Ma, L., Li, L., GonQi, g, X., & Ye, J. (2017). Production and Quality Evaluation of Pineapple Fruit Wine.
Cite This Article
  • APA Style

    Yeshaneh, A. (2024). Production and Optimization of Wine from Mixed (Banana and Watermelon) Fruits Using Sacchromys Crevice. International Journal of Food Science and Biotechnology, 9(3), 46-57. https://doi.org/10.11648/j.ijfsb.20240903.12

    Copy | Download

    ACS Style

    Yeshaneh, A. Production and Optimization of Wine from Mixed (Banana and Watermelon) Fruits Using Sacchromys Crevice. Int. J. Food Sci. Biotechnol. 2024, 9(3), 46-57. doi: 10.11648/j.ijfsb.20240903.12

    Copy | Download

    AMA Style

    Yeshaneh A. Production and Optimization of Wine from Mixed (Banana and Watermelon) Fruits Using Sacchromys Crevice. Int J Food Sci Biotechnol. 2024;9(3):46-57. doi: 10.11648/j.ijfsb.20240903.12

    Copy | Download

  • @article{10.11648/j.ijfsb.20240903.12,
      author = {Asmarech Yeshaneh},
      title = {Production and Optimization of Wine from Mixed (Banana and Watermelon) Fruits Using Sacchromys Crevice
    },
      journal = {International Journal of Food Science and Biotechnology},
      volume = {9},
      number = {3},
      pages = {46-57},
      doi = {10.11648/j.ijfsb.20240903.12},
      url = {https://doi.org/10.11648/j.ijfsb.20240903.12},
      eprint = {https://article.sciencepublishinggroup.com/pdf/10.11648.j.ijfsb.20240903.12},
      abstract = {Winemaking is one of the most ancient technologies and is now one of the most commercially prosperous biotechnological processes. Fruits are one of the most important foods of mankind. They are important for the maintenance of health and improving the quality of our diet. Fruit juices are fermented to produce wine, an alcoholic beverage containing 8 to 11 percent alcohol and 2 to 3 percent sugar with energy values ranging between 70 and 90 kcal per 100ml. Due to the release of amino acids and other nutrients from yeast during fermentation, fruit wines are nutritive and tastier. For this reason, the conversion of fruits to value-added products like wine is very essential. This work aimed to produce and optimize mixed fruit (Banana and Watermelon) wine using saccharomyces cerevisiae. The proximate composition of banana with74 ± 00 of moisture content, 0.33 ± 00 of ash content, 0.23 ± 0.01 crude fat content, 1.65 ± 0.05 crude fiber content, 1.2 ± 0.1 protein content and 22.59% carbohydrate content and 91.5±1.5 moisture content, 0.49 ± 0.017ash content, 0.25 ± 0.01crude fat content, 0.6 ± 0.05 crude fiber content, 0.46 ± 0.02 crude protein content and 6.75% of carbohydrate content watermelon fruit were used for wine production. Primary and secondary fermentation of the fruits lasted for 9 and 21 days respectively, pH, titrable acidity, specific gravity and, total soluble solids (brix) were determined before and after fermentation using standard procedures. The specific gravity of the wine was observed to reduce drastically as the fermentation progressed. The pH of the fruit must decrease from 3 to 2.89 and 4 to 3.2 in different percentage of mixture and titrable acidity also increased 0.67- 0.92 in 75B:25Wm, 0.64 -0.9 in 50B:50Wm, and 0.63-0.89 in 25B:75Wm after fermentation. The highest percentages of alcohol content (9.5) was observed in 75B to 25Wm mixed fruit wine in pH 4 and inoculum size 5, and sensory evaluation revealed that the attributes of the wine were acceptable to the majority of the respondents. This study showed that acceptable wine can be produced from mixed fruits banana and watermelon using yeasts Saccharomyces cerevisiae.
    },
     year = {2024}
    }
    

    Copy | Download

  • TY  - JOUR
    T1  - Production and Optimization of Wine from Mixed (Banana and Watermelon) Fruits Using Sacchromys Crevice
    
    AU  - Asmarech Yeshaneh
    Y1  - 2024/09/06
    PY  - 2024
    N1  - https://doi.org/10.11648/j.ijfsb.20240903.12
    DO  - 10.11648/j.ijfsb.20240903.12
    T2  - International Journal of Food Science and Biotechnology
    JF  - International Journal of Food Science and Biotechnology
    JO  - International Journal of Food Science and Biotechnology
    SP  - 46
    EP  - 57
    PB  - Science Publishing Group
    SN  - 2578-9643
    UR  - https://doi.org/10.11648/j.ijfsb.20240903.12
    AB  - Winemaking is one of the most ancient technologies and is now one of the most commercially prosperous biotechnological processes. Fruits are one of the most important foods of mankind. They are important for the maintenance of health and improving the quality of our diet. Fruit juices are fermented to produce wine, an alcoholic beverage containing 8 to 11 percent alcohol and 2 to 3 percent sugar with energy values ranging between 70 and 90 kcal per 100ml. Due to the release of amino acids and other nutrients from yeast during fermentation, fruit wines are nutritive and tastier. For this reason, the conversion of fruits to value-added products like wine is very essential. This work aimed to produce and optimize mixed fruit (Banana and Watermelon) wine using saccharomyces cerevisiae. The proximate composition of banana with74 ± 00 of moisture content, 0.33 ± 00 of ash content, 0.23 ± 0.01 crude fat content, 1.65 ± 0.05 crude fiber content, 1.2 ± 0.1 protein content and 22.59% carbohydrate content and 91.5±1.5 moisture content, 0.49 ± 0.017ash content, 0.25 ± 0.01crude fat content, 0.6 ± 0.05 crude fiber content, 0.46 ± 0.02 crude protein content and 6.75% of carbohydrate content watermelon fruit were used for wine production. Primary and secondary fermentation of the fruits lasted for 9 and 21 days respectively, pH, titrable acidity, specific gravity and, total soluble solids (brix) were determined before and after fermentation using standard procedures. The specific gravity of the wine was observed to reduce drastically as the fermentation progressed. The pH of the fruit must decrease from 3 to 2.89 and 4 to 3.2 in different percentage of mixture and titrable acidity also increased 0.67- 0.92 in 75B:25Wm, 0.64 -0.9 in 50B:50Wm, and 0.63-0.89 in 25B:75Wm after fermentation. The highest percentages of alcohol content (9.5) was observed in 75B to 25Wm mixed fruit wine in pH 4 and inoculum size 5, and sensory evaluation revealed that the attributes of the wine were acceptable to the majority of the respondents. This study showed that acceptable wine can be produced from mixed fruits banana and watermelon using yeasts Saccharomyces cerevisiae.
    
    VL  - 9
    IS  - 3
    ER  - 

    Copy | Download

Author Information
  • Abstract
  • Keywords
  • Document Sections

    1. 1. Introduction
    2. 2. Material and Method
    3. 3. Result and Discussion
    4. 4. Conclusion
    Show Full Outline
  • Abbreviations
  • Acknowledgments
  • Author Contributions
  • Conflicts of Interest
  • References
  • Cite This Article
  • Author Information